Predicting Credit Default
A leakage-free machine-learning pipeline that estimates every applicant's probability of default and turns it into approve / review / reject decisions — lifting recall from 61% to 80.5% at the same cutoff (86% at a recall-first cutoff) and cutting simulated losses by 81% on this dataset.
A lender loses money in two ways: approving a client who later defaults, and rejecting a good client who would have paid. In this portfolio (32,581 loans from the public Kaggle Credit Risk dataset, 32,409 after cleaning) about 22% of loans defaulted. The goal was to estimate each applicant's probability of default so a credit team can approve, review or reject based on risk — and to measure what that is actually worth in money, not just in accuracy points.
From a k-NN baseline to a calibrated risk engine
The project has two versions. The original compared k-NN and SVM and reached 61% recall. Version 2 rebuilds the work from the ground up and is the one summarised below; the original is kept in the repository unchanged.
Cleaning & framing the problem
Removed impossible records (ages above 100, employment histories longer than a working life) and framed the goal around recall on defaulters rather than accuracy: a model that approves everyone is still roughly 78% accurate while the bank loses money on the other 22%.
Leakage-free pipelines
In the original version, imputation and encoding ran on the full dataset before the train/test split. In v2 every preprocessing step — imputation, scaling, encoding — sits inside a pipeline and is fitted on training data only, so the test results are an honest estimate of performance on new applicants.
Model comparison with cross-validation
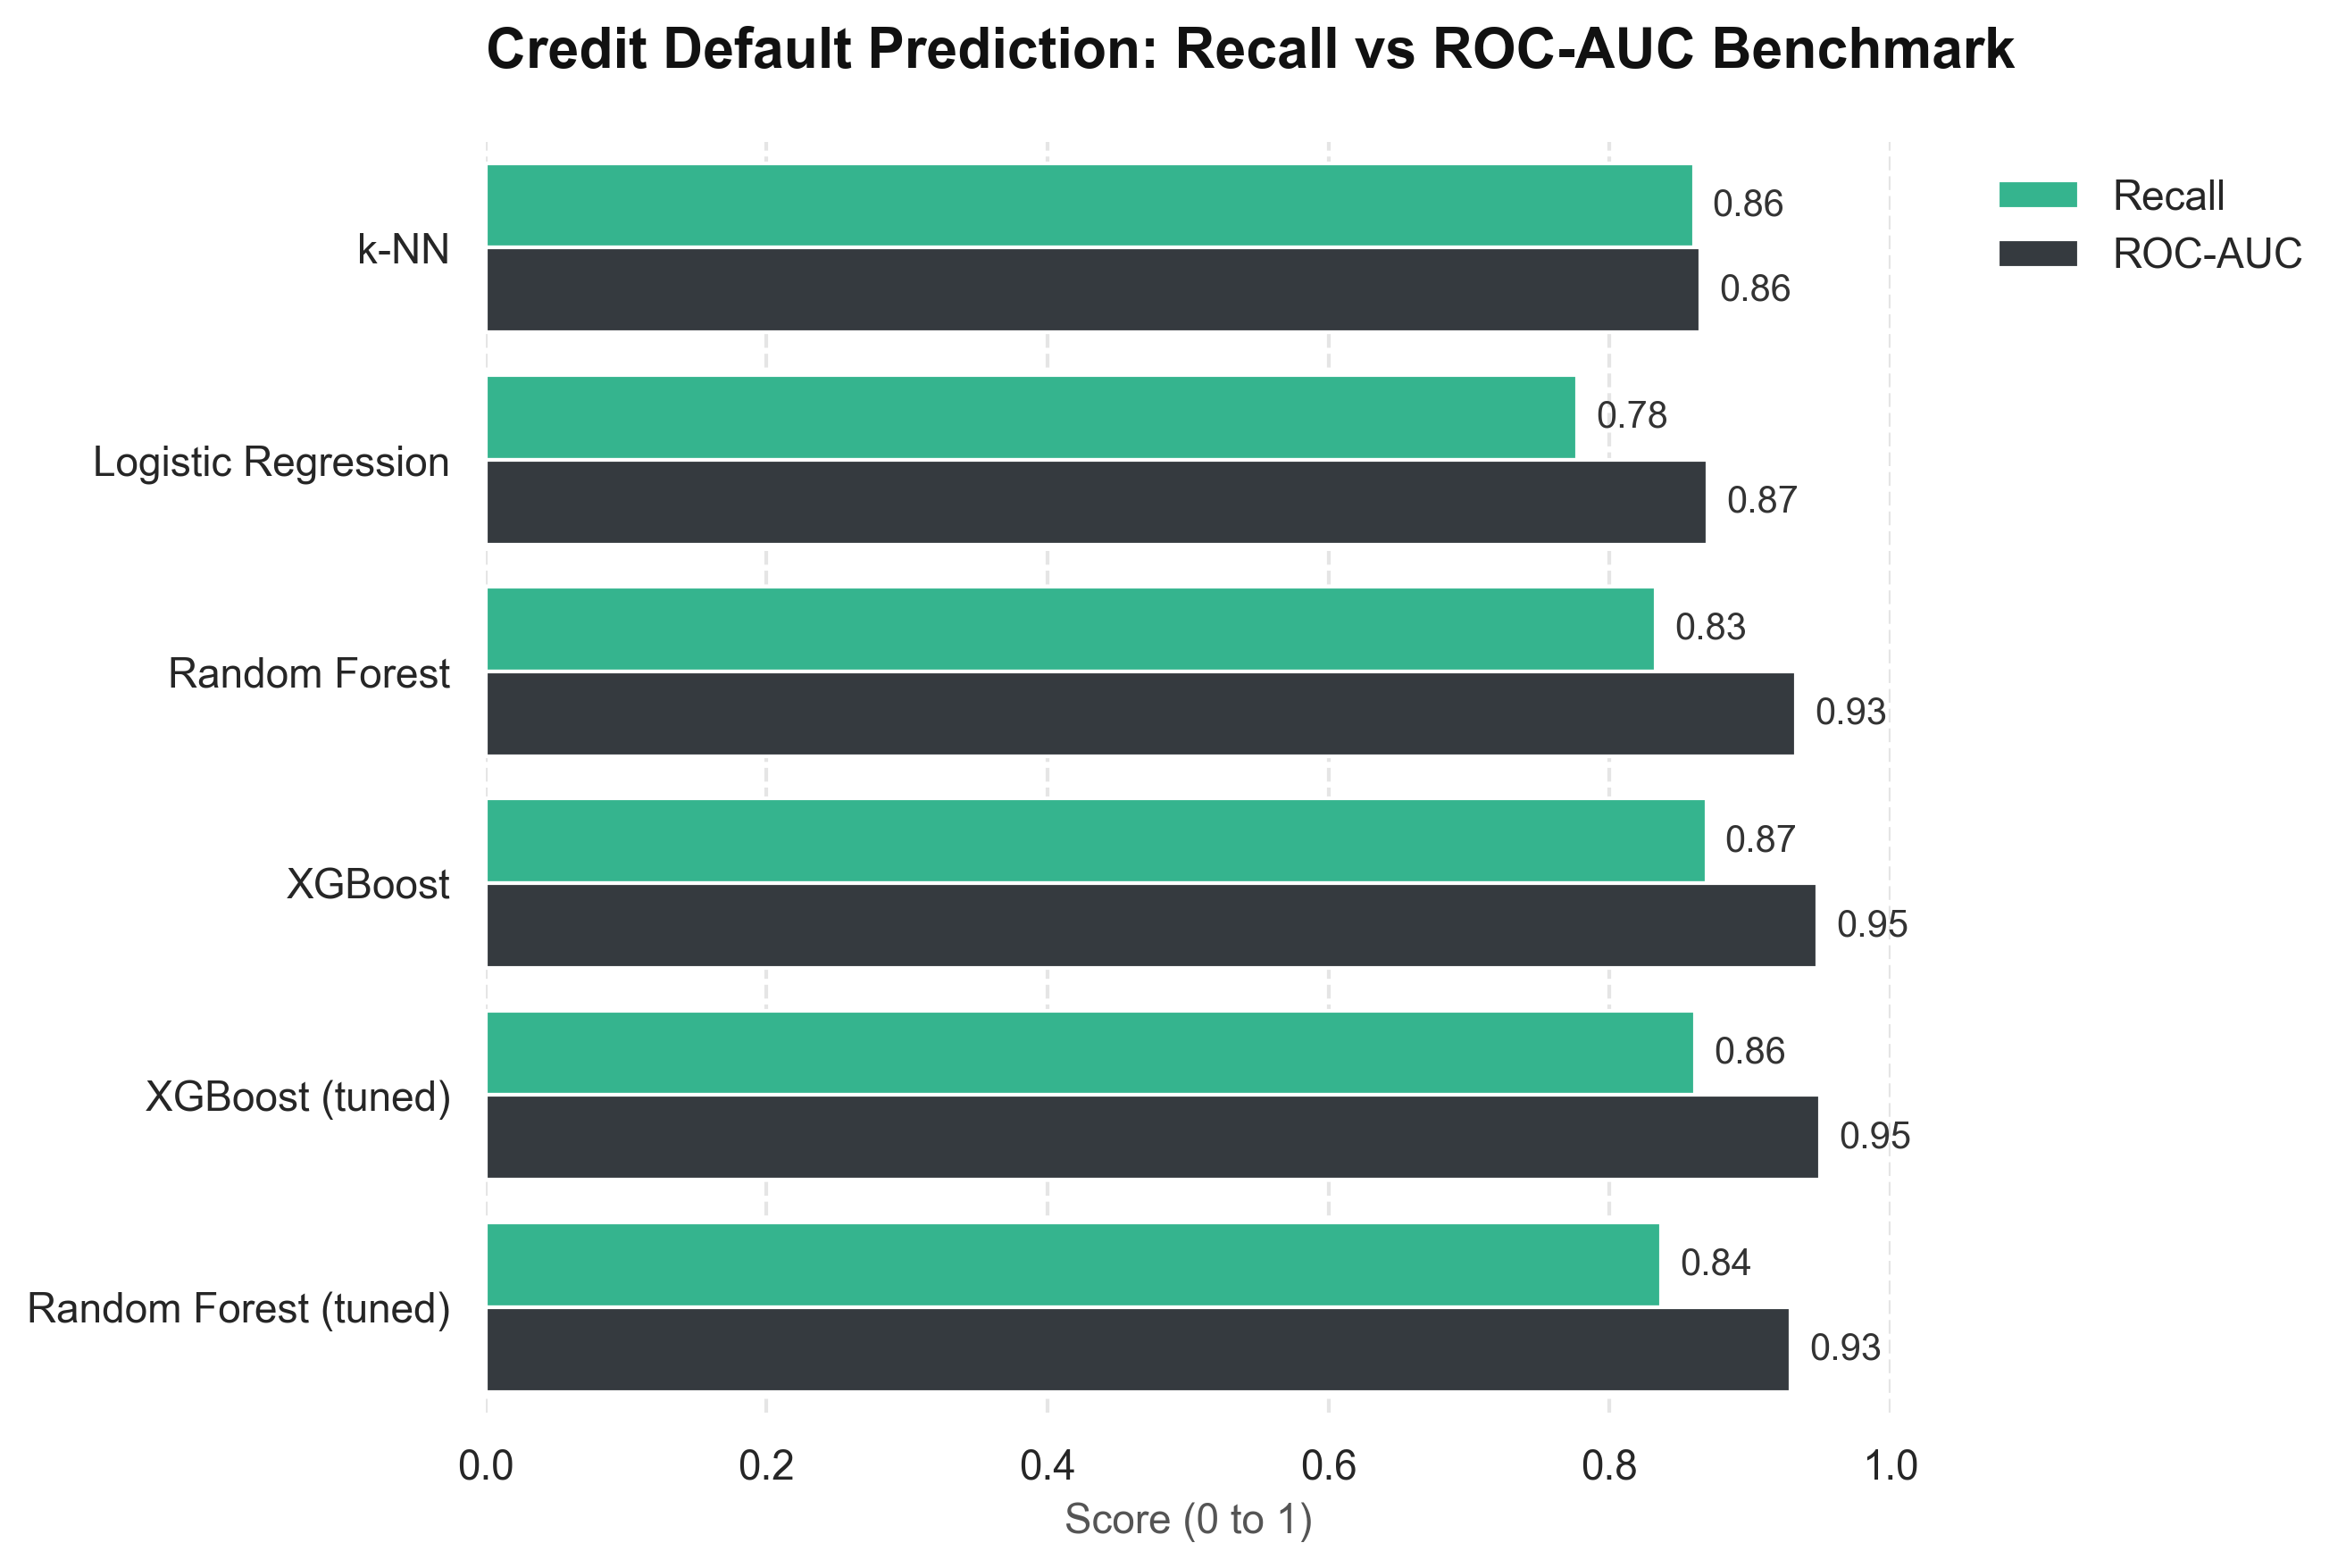
Compared k-NN, Logistic Regression, Random Forest and XGBoost using stratified 5-fold cross-validation, then tuned the two strongest tree models. Results are reported on a 30% hold-out test set that was never used for tuning.
Choosing the decision threshold
A 0.5 cutoff is rarely right for a lender. The threshold was chosen on out-of-fold training predictions, favouring recall (F2), and the final numbers carry 95% bootstrap confidence intervals so the uncertainty is visible.
Probability calibration
The raw model overstated risk — a mean predicted default probability of 29.2% against 21.9% observed. Isotonic calibration brought it to 22.1% and cut the Brier score from 0.064 to 0.052 without hurting ranking quality.
Explainability & stress tests
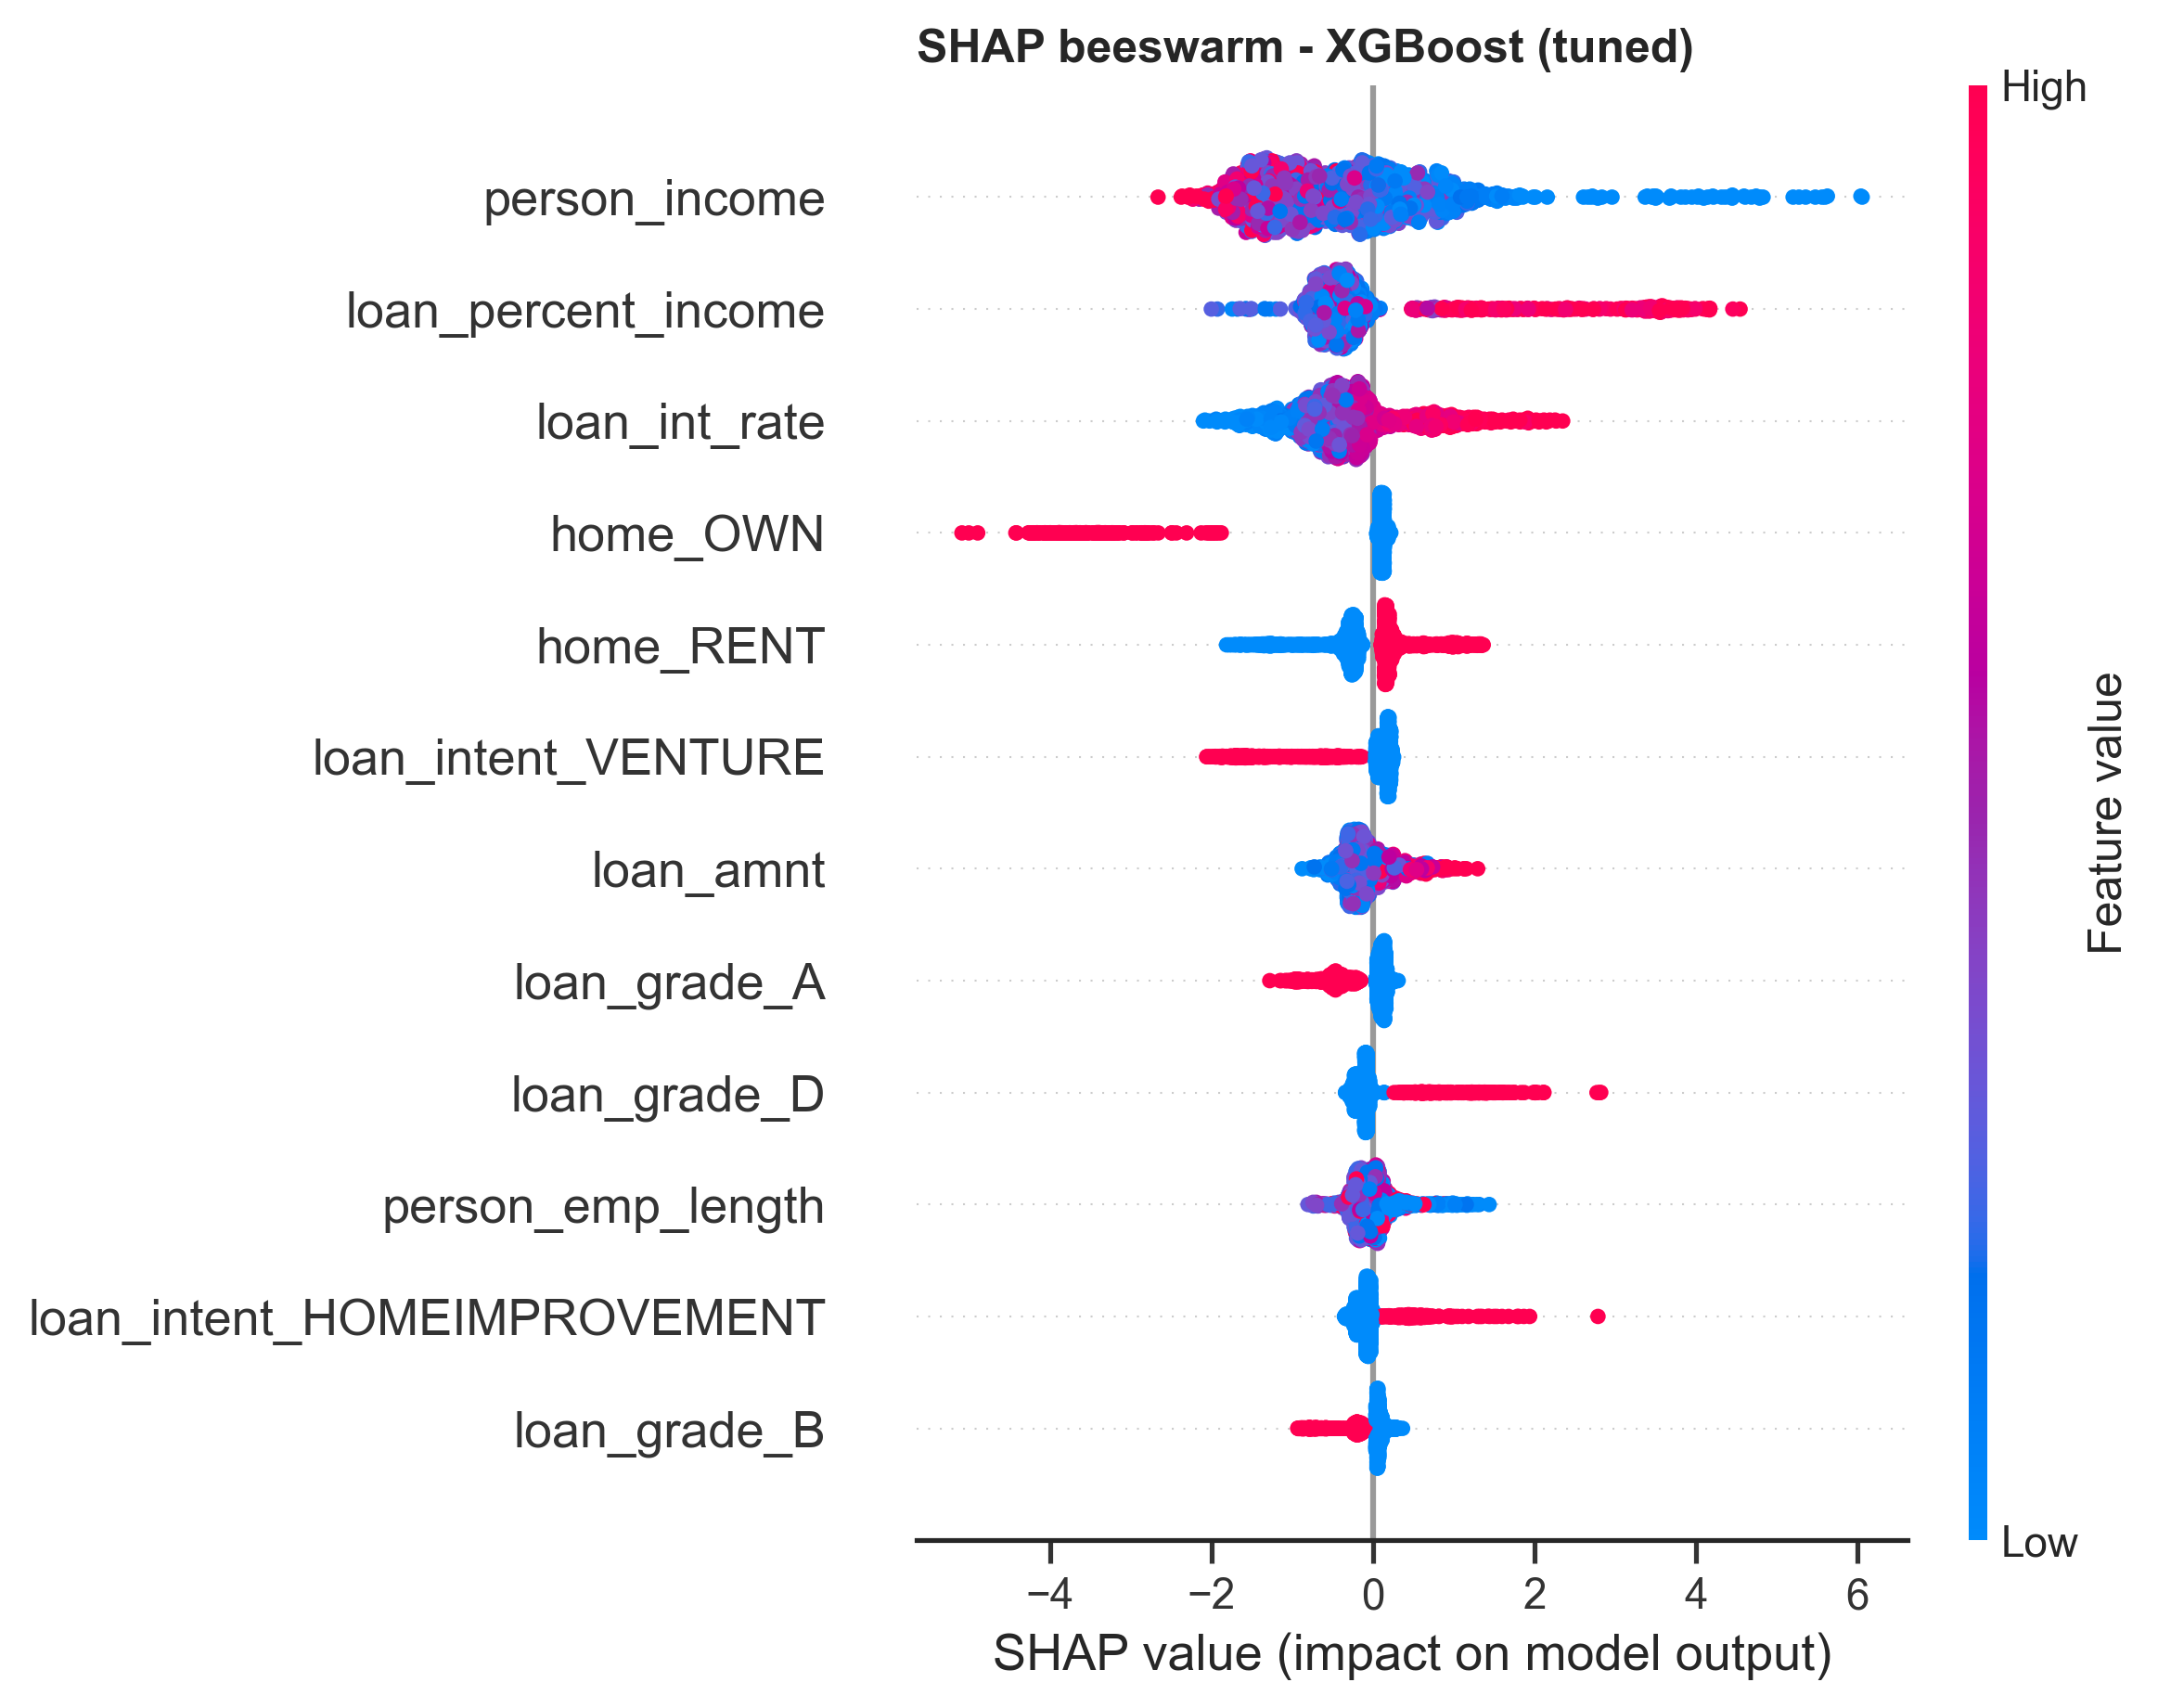
SHAP values show what drives each decision. Ablation tests removed the lender's own pricing signals (loan grade and interest rate) and the applicant's age to check that the model is not simply echoing an earlier score or leaning on a sensitive variable.
Translating the model into money
Scored all 32,409 clients, split them into Low / Medium / High risk bands, and ran a cost analysis (illustrative 60% loss given default plus one year of forgone interest) comparing the model against approving everyone and against a simple "reject grades D to G" rule.
Tree models win because risk lives in combinations
| Model | ROC-AUC | PR-AUC |
|---|---|---|
| k-NN | 0.865 | 0.735 |
| Logistic Regression | 0.870 | 0.708 |
| Random Forest | 0.933 | 0.886 |
| Random Forest (tuned) | 0.929 | 0.878 |
| XGBoost (tuned) | 0.950 | 0.907 |
Hold-out test set (30% of loans). Linear and distance-based models plateau because default risk depends on combinations of variables — for example loan grade together with loan-to-income — which trees capture naturally.
What the model and the data showed
- The model catches 80.5% of defaulters where k-NN catches 61.1%. Both are measured at the same default 0.5 cutoff, and precision is unchanged (83.1% vs 82.6%): that is the gain of the model. Lowering the cutoff to the tuned 0.35 raises recall further to 86.1% (95% CI 84.7% to 87.6%), but precision falls to 66.8%: that is the gain of the cutoff, and it is a trade-off, not a free improvement.
- 81% lower simulated loss. Using the model as a credit filter cuts the simulated loss from USD 13.97M to USD 2.67M versus approving every loan (95% CI 79.1% to 82.6%). The naive "reject grades D to G" rule saves 37.3%. Across a range of cost assumptions the saving stays between 75.5% and 84.3%. Like the ROC-AUC, it is an upper bound for this dataset (see below).
- Risk bands separate clients cleanly. On the whole portfolio (out-of-fold scores) the observed default rates are 2.1% for Low risk (17,364 clients), 11.4% for Medium (7,302) and 76.1% for High (7,743), and the High band holds about 82% of the expected loss. On the held-out test set, the model fitted on the training data gives 2.8%, 11.4% and 68.1% for the three bands, so new clients should be expected to look like the second set.
- Loan size relative to income is the sharpest signal. Loans above 30% of income default 70.4% of the time, against 11.6% below 10%. A prior default on file lifts the rate from 18.4% to 37.9%.
- The model is more than the lender's own score. Without loan grade and interest rate, ROC-AUC falls from 0.950 to 0.904 — part of the signal is earlier pricing, but a substantial independent signal remains. Removing age costs almost nothing (0.948).
- The labels look rule-generated, so the headline figures are a ceiling. All 2,339 renters whose loan is at least 31% of their income defaulted, with no exception: 7% of the clients and 33% of all defaults. A decision tree with just two levels already reaches a ROC-AUC of about 0.80, and without that group the out-of-fold ROC-AUC falls from 0.951 to 0.926. Real portfolios rarely contain rules this clean, so 0.95 and the 81% saving are an upper bound for this dataset, not an expectation for real data.
From v1 to v2: how much did the project improve?
I kept the original version of the project untouched so the progress is measurable. The table compares both versions of the Python work; the original notebook and dashboard stay in the repository and the original dashboard stays online.
| Python model | v1 (original) | v2 (rebuilt) |
|---|---|---|
| Data after cleaning | 31,679 loans | 32,409 loans |
| Models compared | k-NN, linear SVM | k-NN, Logistic Regression, Random Forest, XGBoost (tuned) |
| Preprocessing | Imputation and encoding on the full dataset before the split | Leakage-free pipelines, fitted on training data only |
| Evaluation | One train/test split | Stratified 5-fold cross-validation, tuned threshold, bootstrap confidence intervals |
| Best model | k-NN (k=5) | XGBoost (tuned) |
| Defaulters caught (recall) at the default 0.5 cutoff | 61% | 80.5% |
| Precision on defaulters at the default 0.5 cutoff | 85% | 83.1% |
| Overall accuracy at the default 0.5 cutoff | 89% | 92.2% |
| Recall at a recall-first cutoff (0.35) | Not tuned | 86.1% (95% CI 84.7%–87.6%), with 66.8% precision |
| ROC-AUC | Not measured | 0.950 (an upper bound for this dataset) |
| Probability calibration | No | Isotonic (Brier score 0.064 → 0.052) |
| Explainability | None | SHAP values |
| Business value | Not quantified | 81% lower simulated loss (USD 13.97M → 2.67M) |
| Robustness checks | None | Ablation tests (loan grade, interest rate, age) |
Fair comparison: the same k-NN rebuilt in v2 at the same 0.5 cutoff catches 61.1% of defaulters with 82.6% precision and 88.7% accuracy — essentially the v1 result. So the leakage-free methodology makes the estimate honest but does not by itself raise recall. The improvement has two separate sources: the model (at the same cutoff, recall goes from 61.1% to 80.5% with the same precision) and the cutoff (lowering it to 0.35 takes recall from 80.5% to 86.1%, while precision falls from 83.1% to 66.8%). The second is a deliberate trade-off, not a free gain: any model gains recall this way (k-NN reaches 86.0% at a 0.05 cutoff, with 41.9% precision).
The Power BI dashboard, before and after
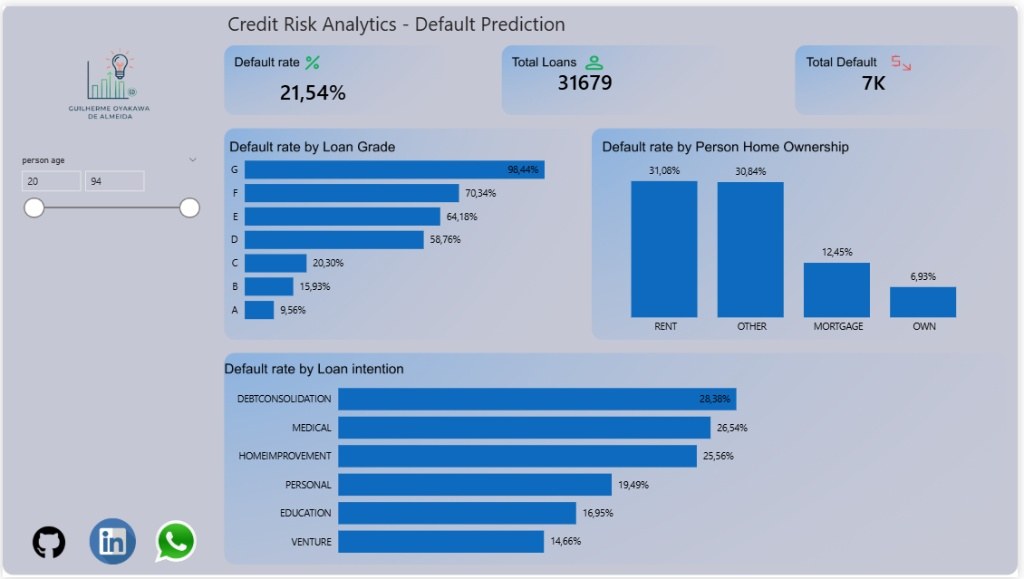
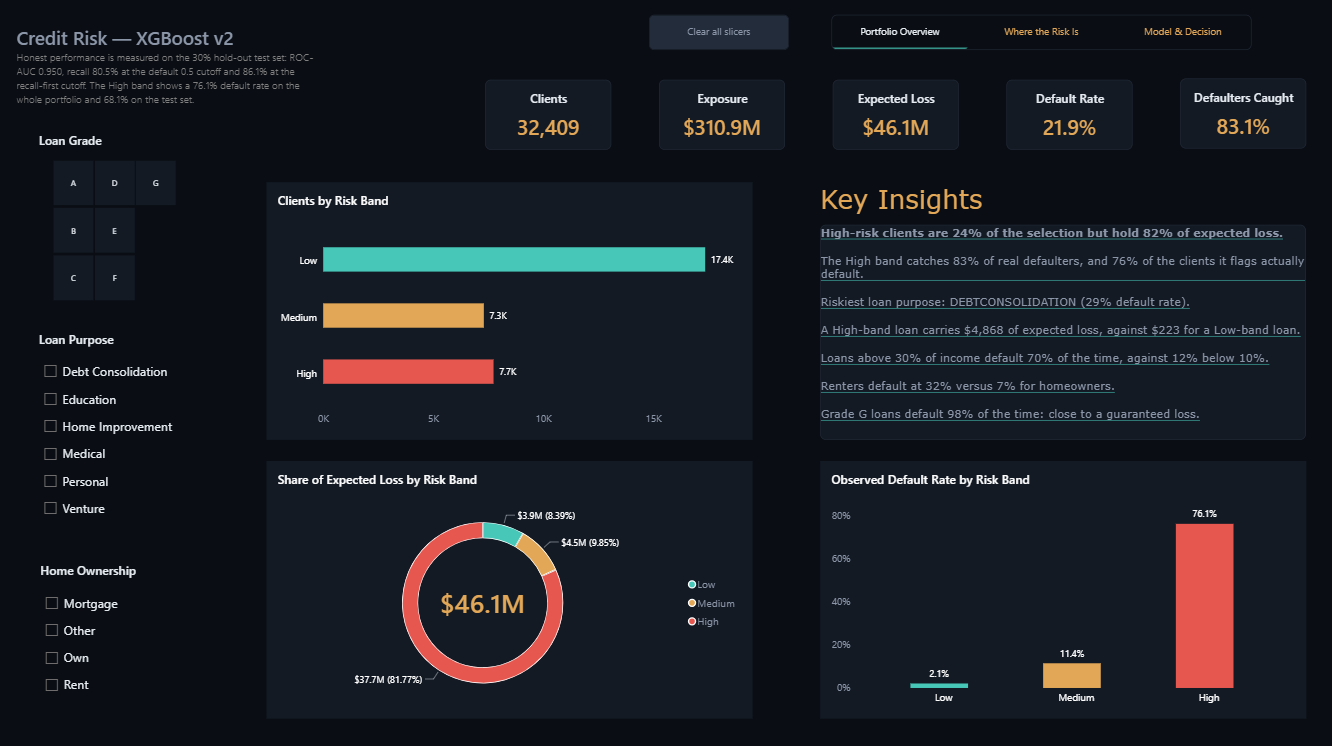
| Power BI | v1 (original) | v2 (rebuilt) |
|---|---|---|
| Pages | 1 | 3 (Portfolio Overview, Where the Risk Is, Model & Decision) |
| Data behind it | Raw loan data | Every loan scored by the model: default probability, risk band, expected loss |
| What it answers | Where did defaults happen? | Who is likely to default, how much would it cost, and what should the bank do? |
| Interactivity | Age slider | Loan grade, purpose and home-ownership filters, page tabs, clear-all button |
| Insights | Static visuals | Dynamic text that updates with every filter |
| Model transparency | None | Model comparison table and SHAP risk drivers |
| Design | Default light layout | Dark theme matching this portfolio, with a semantic colour code for risk |
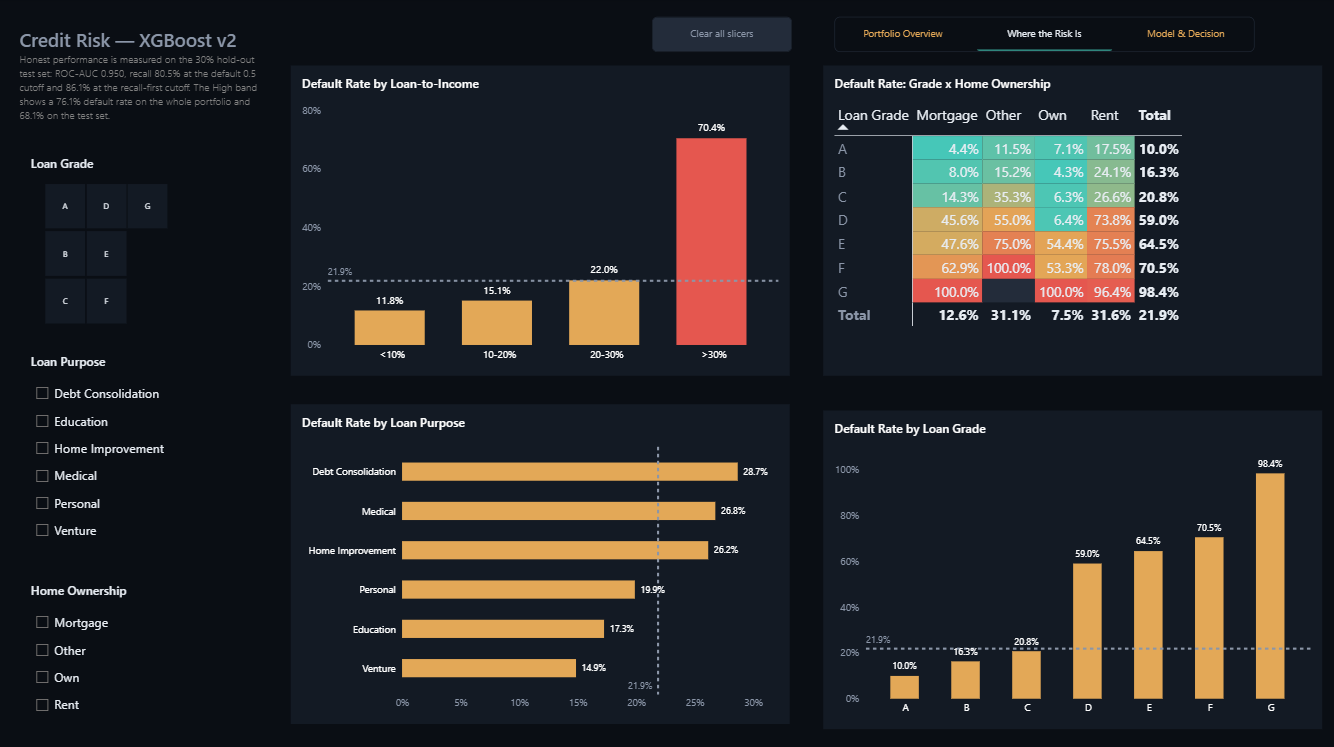
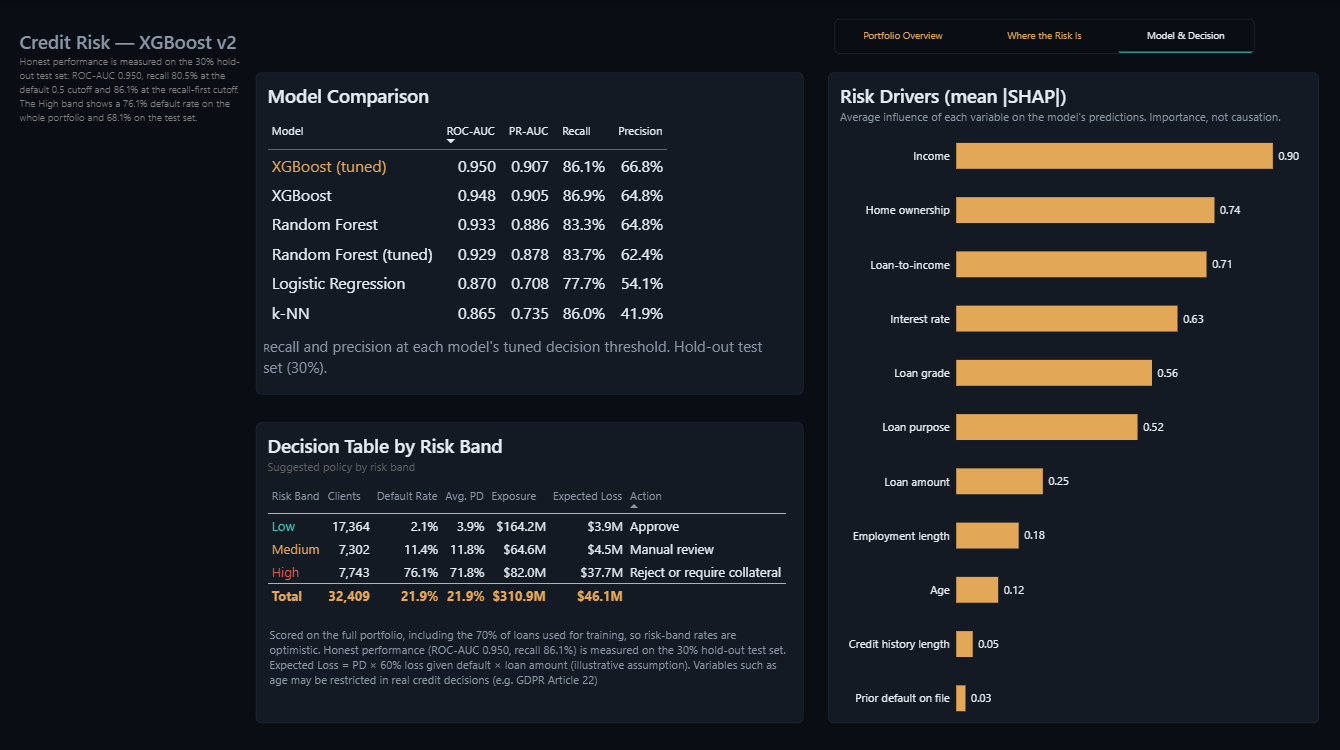
Explore the Power BI dashboard
Interactive three-page report built on the v2 model scores: portfolio overview, where the risk is concentrated, and model performance with a decision table by risk band. Use the filters and the page tabs to explore.
Having trouble viewing it? Open the dashboard directly. Original v1 write-up: Predicting Credit Default.
The result is a path from a single yes/no score to a risk-based lending policy: approve the Low band, review the Medium band, and focus scarce attention on the High band where most of the expected loss sits. The fix is not to stop lending — it is to price and screen risk with evidence.
Caveats: the ROC-AUC of 0.95 and the 81% saving are an upper bound for this dataset, whose labels look rule-generated (see the key findings); cost figures are illustrative US-dollar assumptions (the notebook includes a sensitivity analysis); the data is a snapshot with no time dimension and outcomes only for approved loans; and variables such as age may be restricted in real credit decisions, so a compliance review would be required before any real use.